Test reports for Jira that answer your release questions.
Which requirements are not safe to ship? Which Done stories are not proven by tests? When will testing finish? Seven built-in reports answer inside Jira, and say why in plain words.
- 7 built-in reports
- 36 questions to start from
- Custom reports from 20 widgets
- Free up to 10 users
One question per report.
A page that shows how it answers.
The same cards you find on the reports home in the app. Each page shows the report on real screens, its ready questions and the rule behind each number.
Test execution
How the testing goes: progress, runs, time and defects.Traceability and coverage
Is each requirement and work item tested, and is it safe to ship?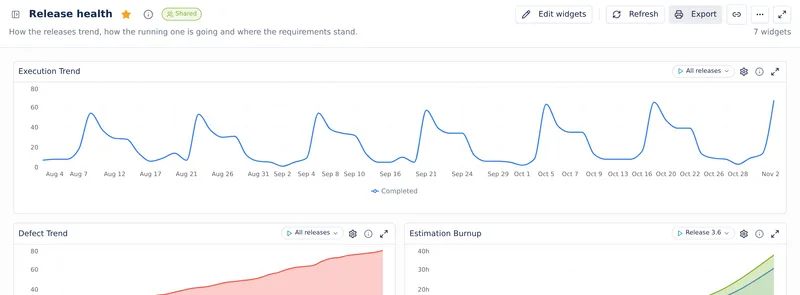
Four tools, or one app in Jira.
From the requirement to the report.
Many teams keep a requirement tool, a test tool, a reporting tool and an Excel sheet that somebody updates on Friday. BesTest keeps the requirements, the tests, the runs and the reports together in Jira, so the report is current when you open it.
 One app in Jira
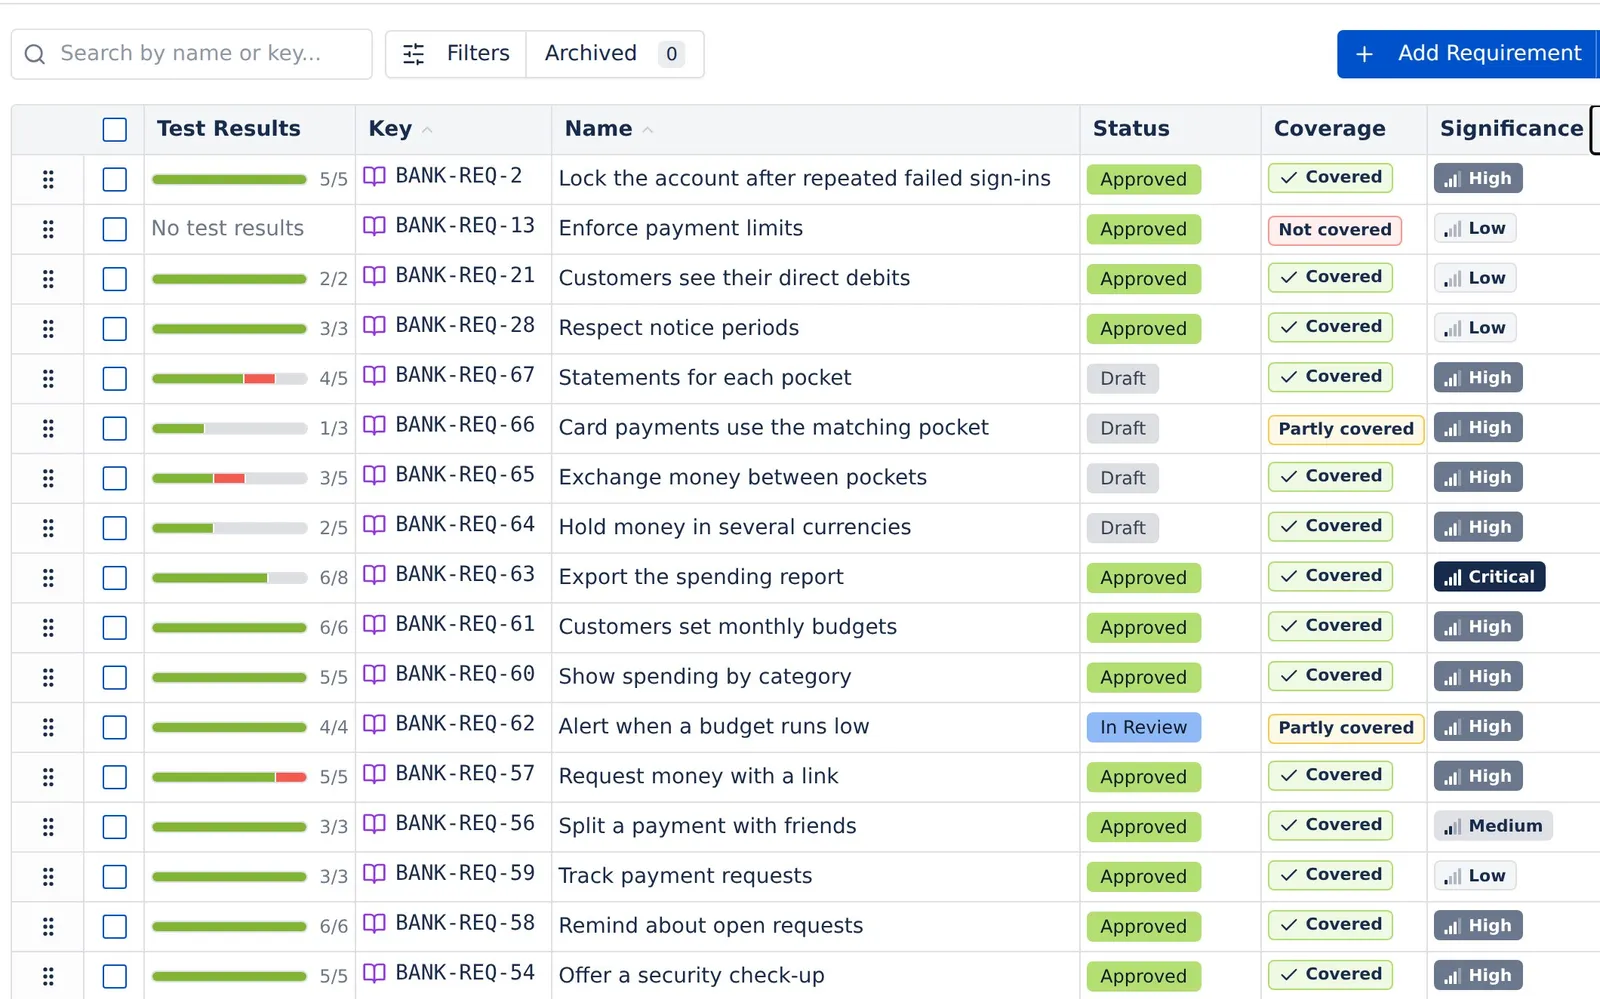

Significance from impact and complexity
Set Impact and Complexity, and each requirement gets its significance. The significance sets how many test cases it needs: Critical 8, High 5, Medium 3, Low 1.
Approve it before you build on it
A requirement goes through review and approval. Its header shows who approved it and when.
Work items and tests in one place
Link a requirement to its Jira work items and to the test cases that prove it. Its header shows readiness, coverage and pass rate.
Each report answers one question.
Then lets you ask the next one.
The real app, on the demo space Helios Mobile Banking: eight releases of a mobile banking app, its testers and the defects they found. Open the same data in the live demo.
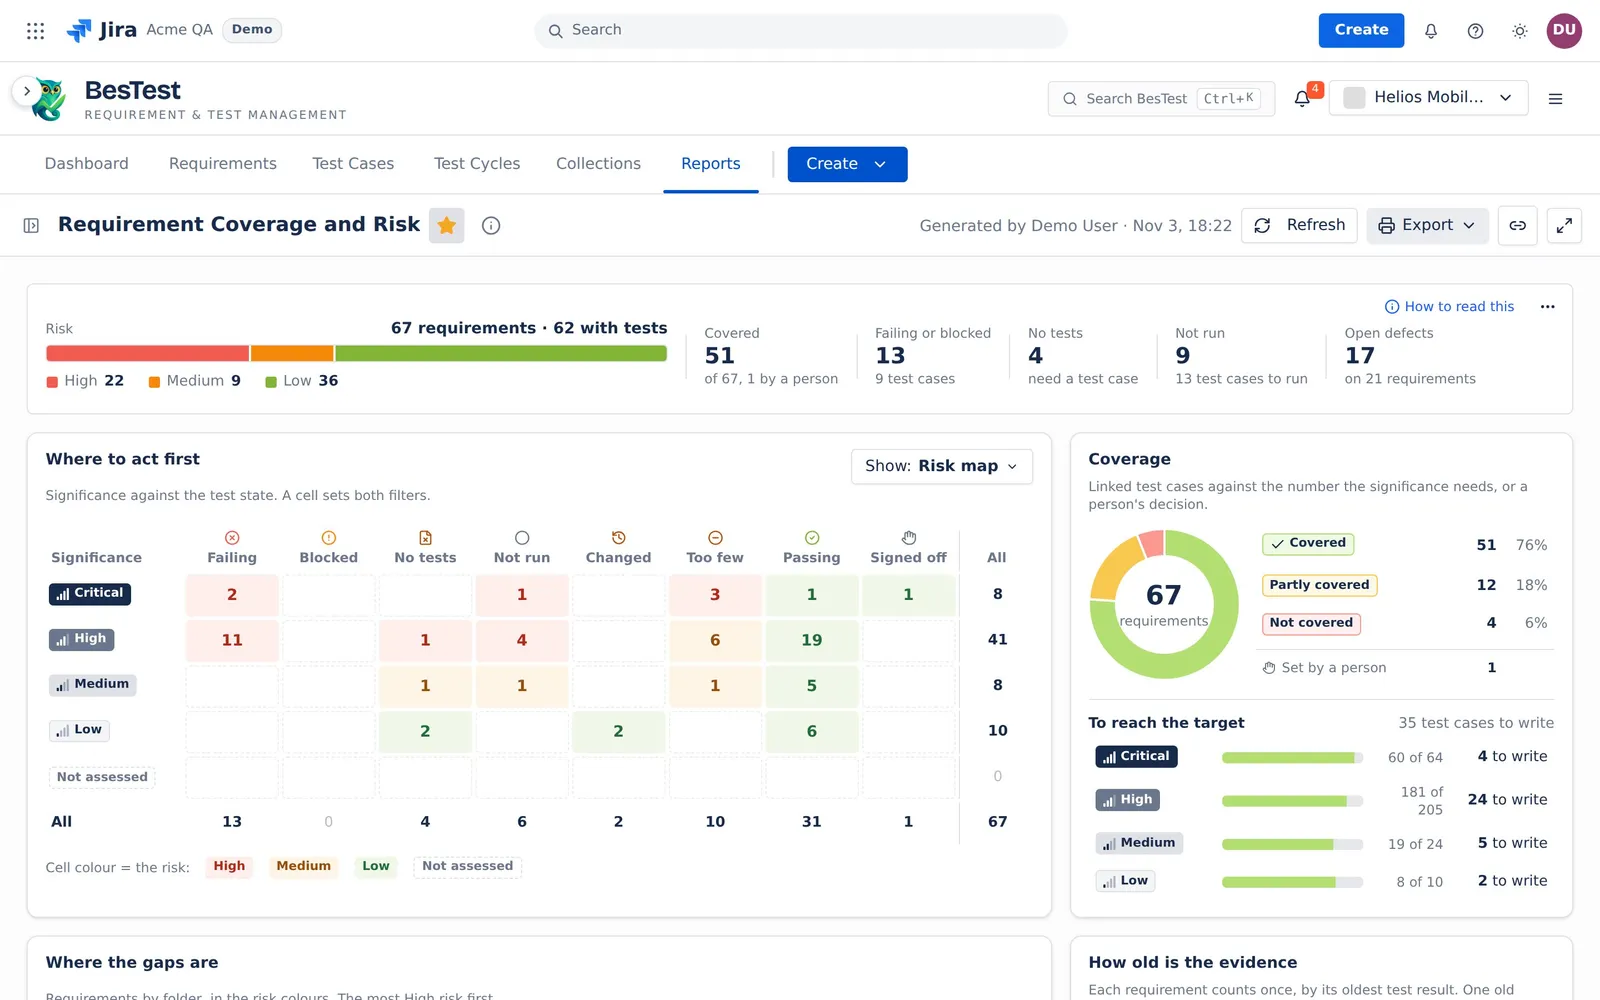
Which requirements are not safe to deliver, and why.
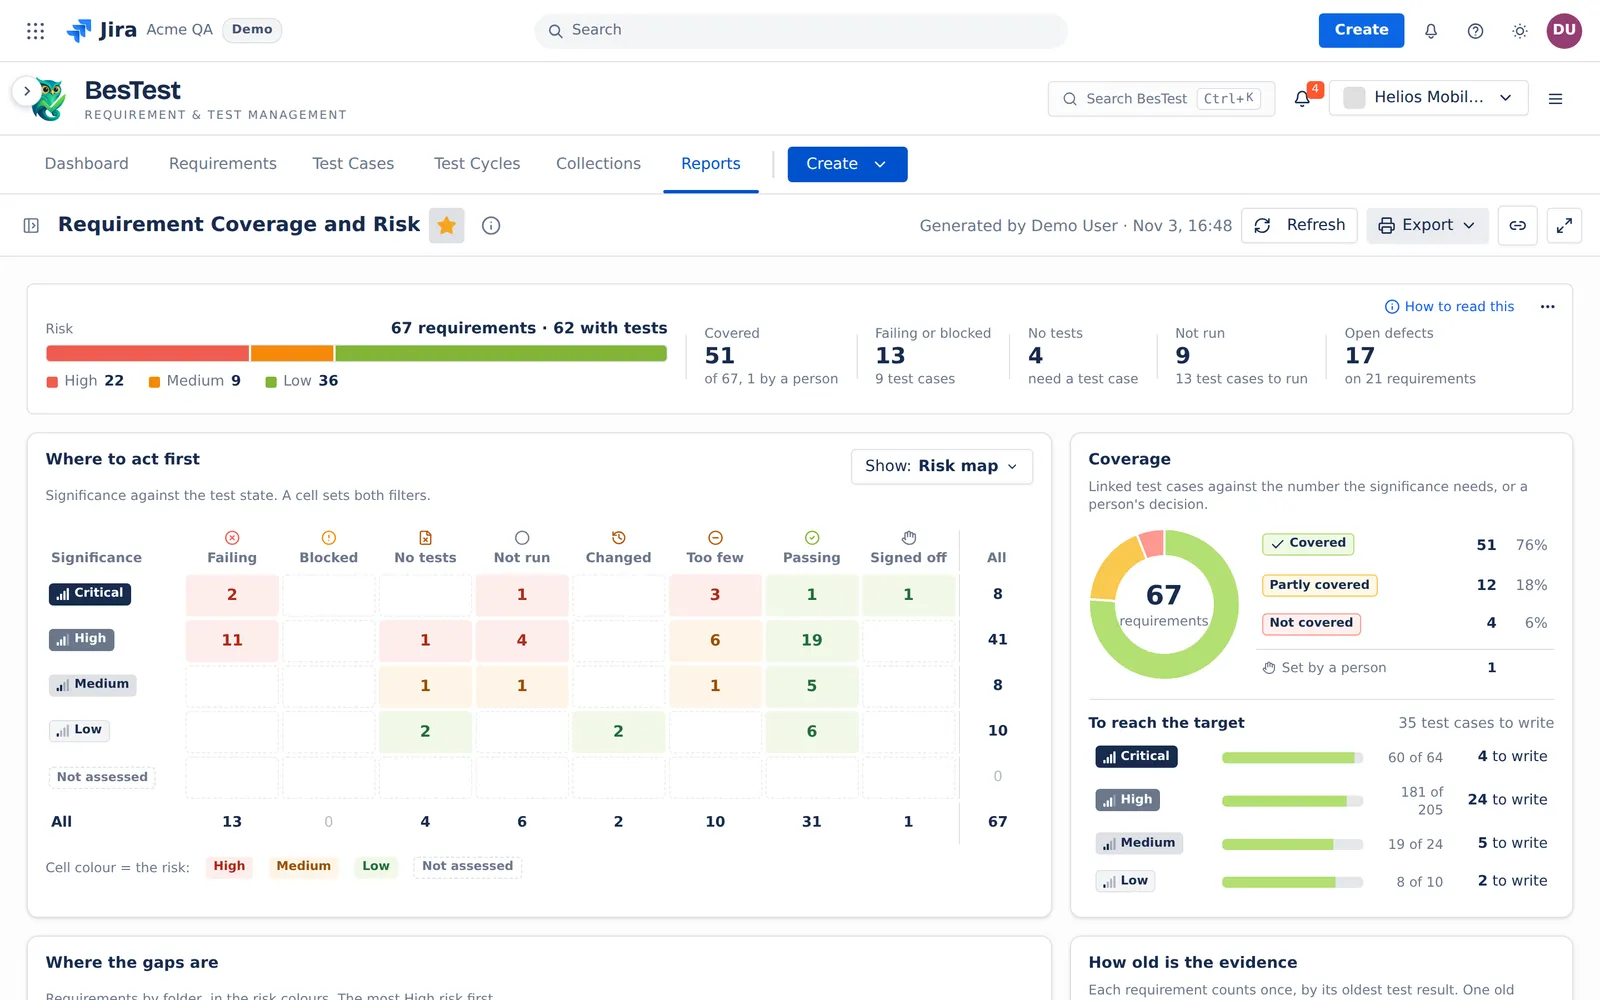
- 1. One line for the whole scope67 requirements, 22 of them High risk. Click a number for its requirements.
- 2. How to read thisEach figure explains its rule with your numbers.
- 3. Where to act firstSignificance against test state. A cell sets both table filters.
- 4. To reach the target35 test cases still to write, per significance.
- 5. SourcesA folder, a BQL rule, Jira work items, or a saved data set.
From a number to the reason.
In two clicks.
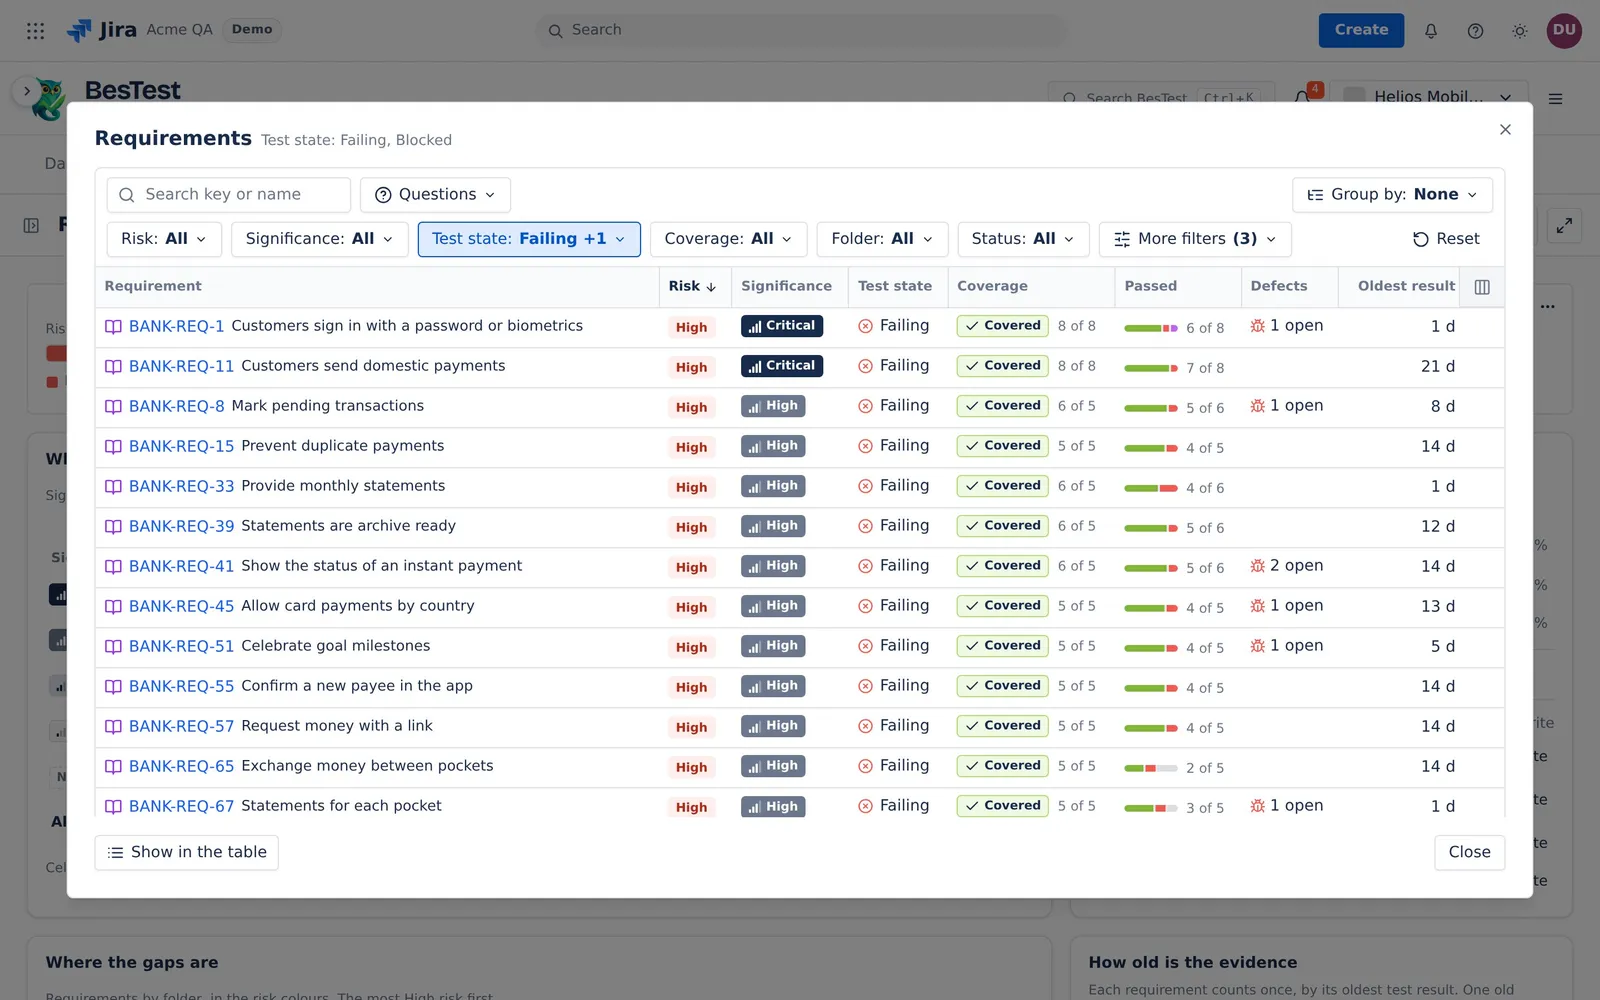
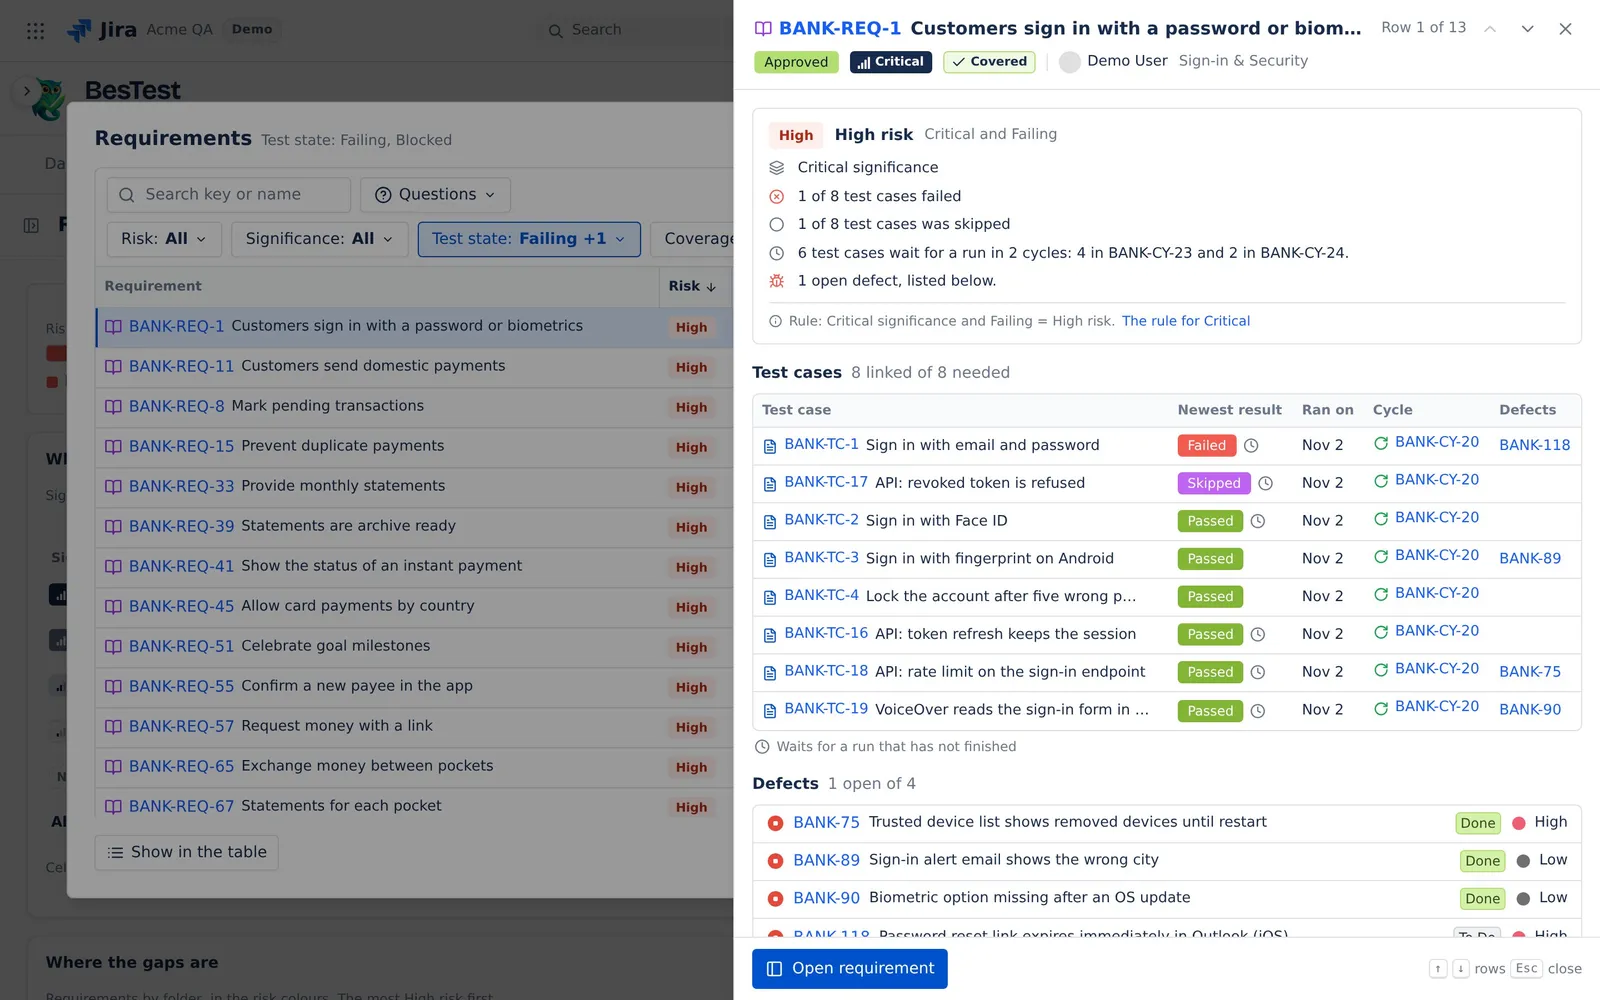
A number in a report is a door. Click it to see the rows behind it. Click a row to read why, in plain words, with the rule that decided it.
A number opens its rows in Requirement Coverage and Risk, Work Item Traceability, the Traceability Matrix and Defect Analysis, and the charts open their runs in Test Execution Results. Six of the seven reports open a side panel for a row. How each number is calculated: the docs.
The report your team asks for every Monday.
Built once, from 20 widgets.
Pick widgets, place them on a canvas, run each one on a source of a shared data set. Keep the report private or share it with your space. Star it, copy its link, print it.
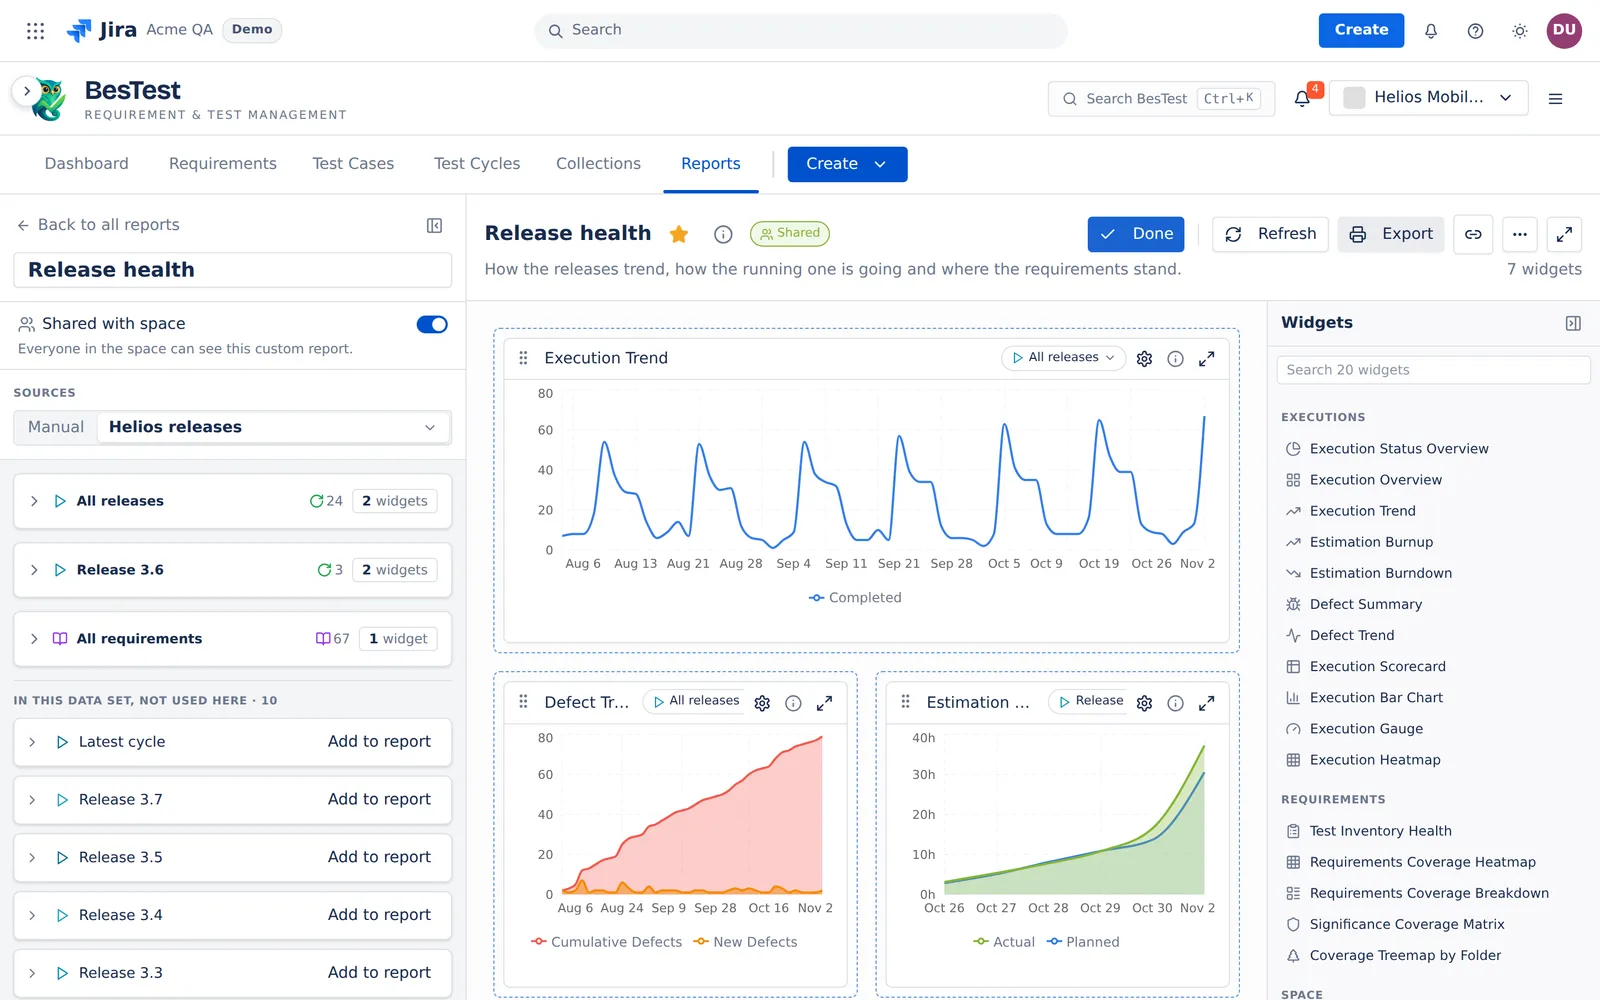
- 1. A custom report"Release health", shared with the space. Private until you share it.
- 2. 20 widgetsThe same 20 as the Jira dashboard gadget: executions, requirements, the space.
- 3. Sources from a data setHere "Helios releases": every release, the running one, all requirements.
- 4. Drag to moveSize S, M or L. Open any widget full size.
- 5. A source per widgetThe trend reads every release. The burn-up reads the running one.
AI makes tests fast.
Your reports stay in order.
An agent can write 50 test cases and start 10 cycles in an afternoon. Put the cycles of a release in a campaign, or define a data set once: a campaign, a cycle folder, the latest cycle, a Jira query, a BQL filter. A data set saves the rules, not a copy of the rows, so a new cycle joins the report by itself. Point at a report to see which sources it reads.
A built-in report reads one source per slot. The other sources of the data set wait under "In this data set, not used here", one click away. A data set is private until you share it with your space. How data sets work.
Most questions end in the app.
The rest leave as a file.
| Report | Print (PDF) | CSV | Excel |
|---|---|---|---|
| Test Execution Results | Yes | No | No |
| Test Execution Explorer | Yesa record to sign | Yes | Yes |
| Test Execution Time | Yes | Yes | Yes |
| Defect Analysis | Yes | No | No |
| Requirement Coverage and Risk | Yes | Yes | No |
| Work Item Traceability | Yes | Yes | No |
| Traceability Matrix | Yes | Yes | No |
| Custom reports | Yes | No | No |
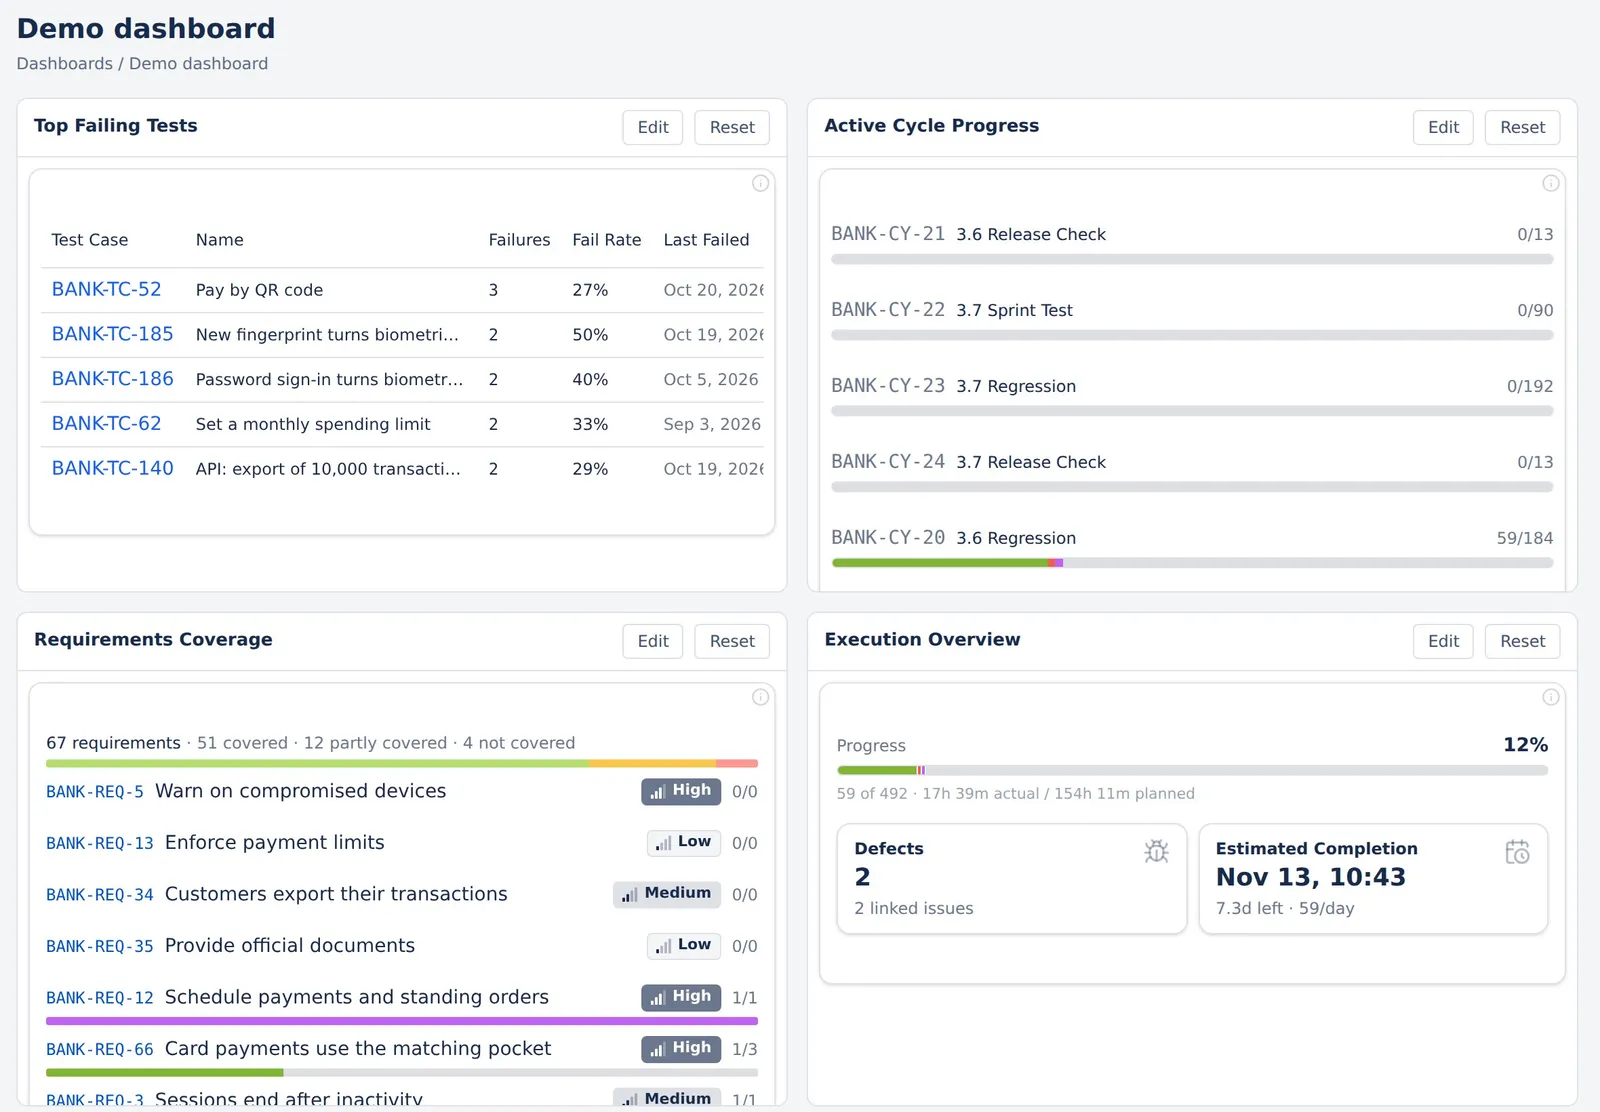
Put the same widgets
on your Jira dashboard.
One Jira dashboard gadget with 20 widget types. Put coverage, progress and trends where your managers already look.
See the gadgetCheck the release
from the train.
The reports work in Jira on a phone: the top line, the questions and the side panels stack in one column. Build a custom report on the laptop, read it anywhere.
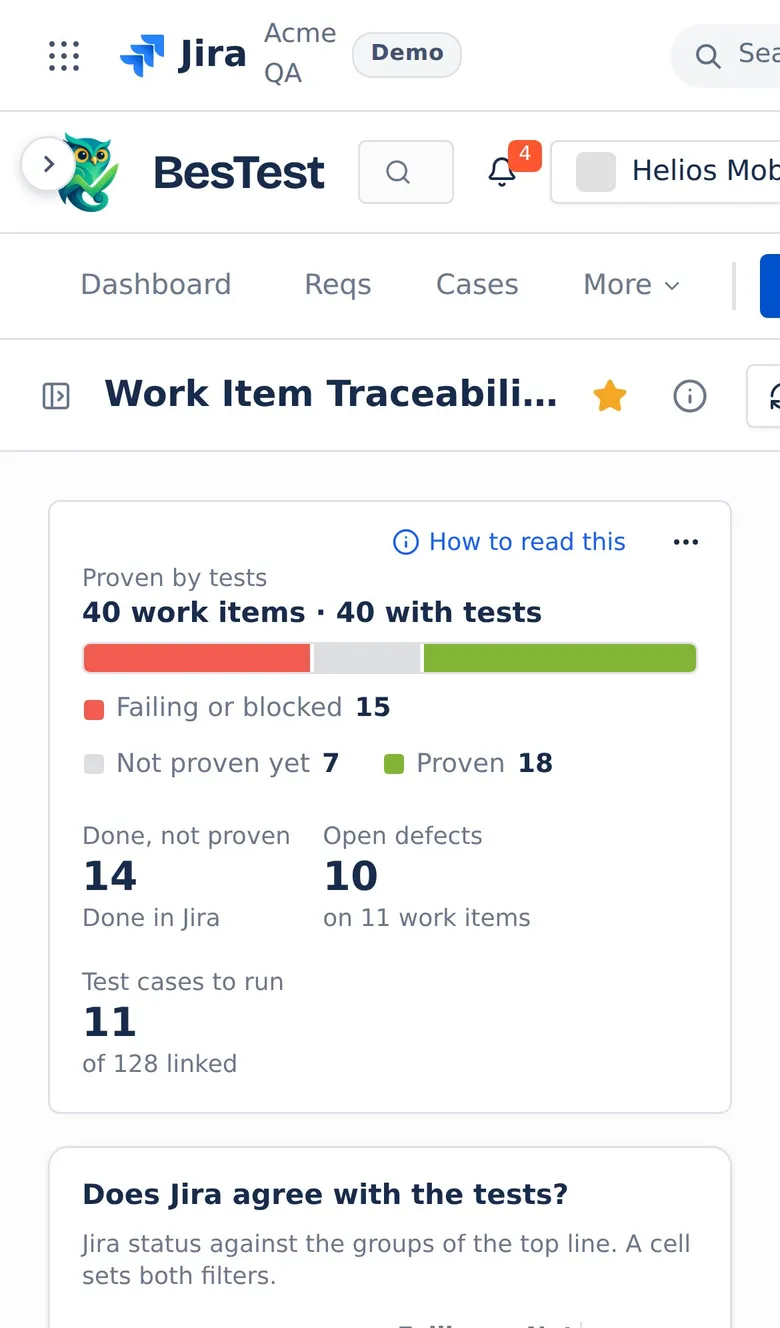
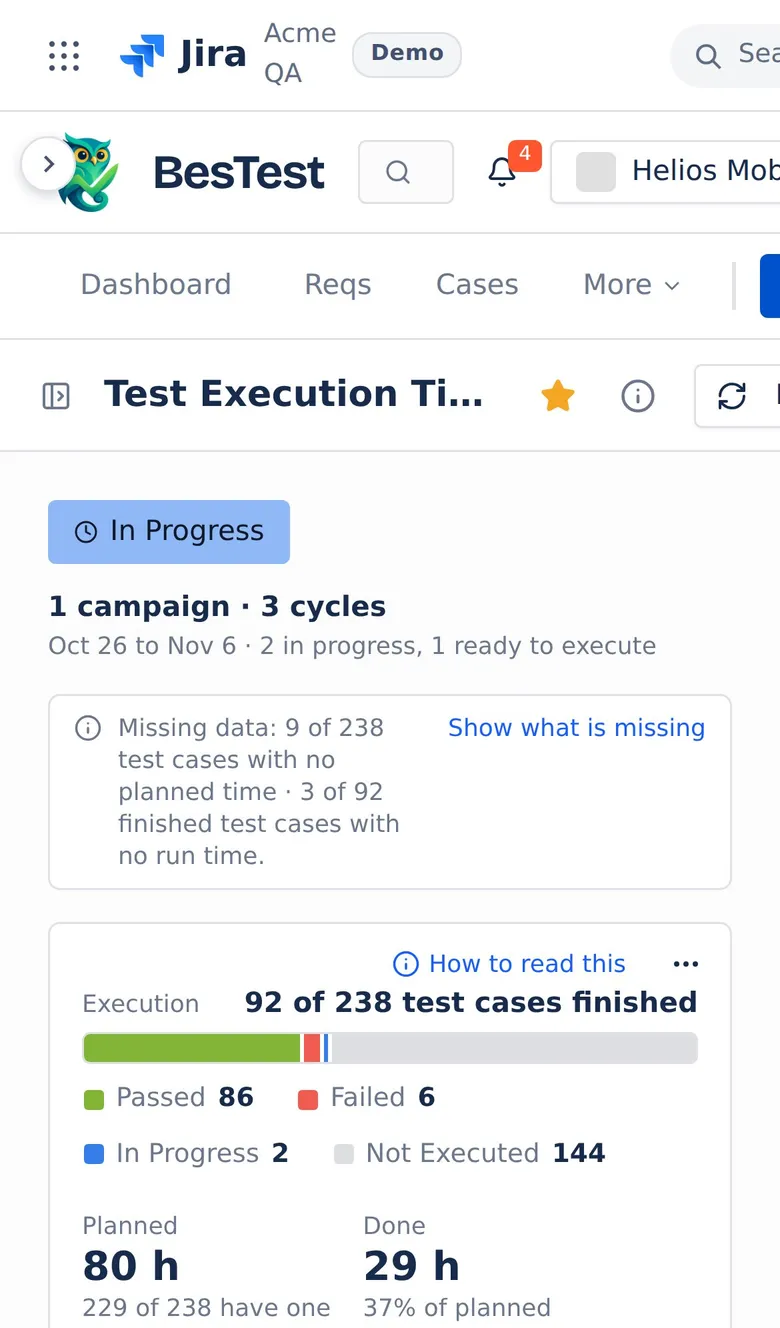
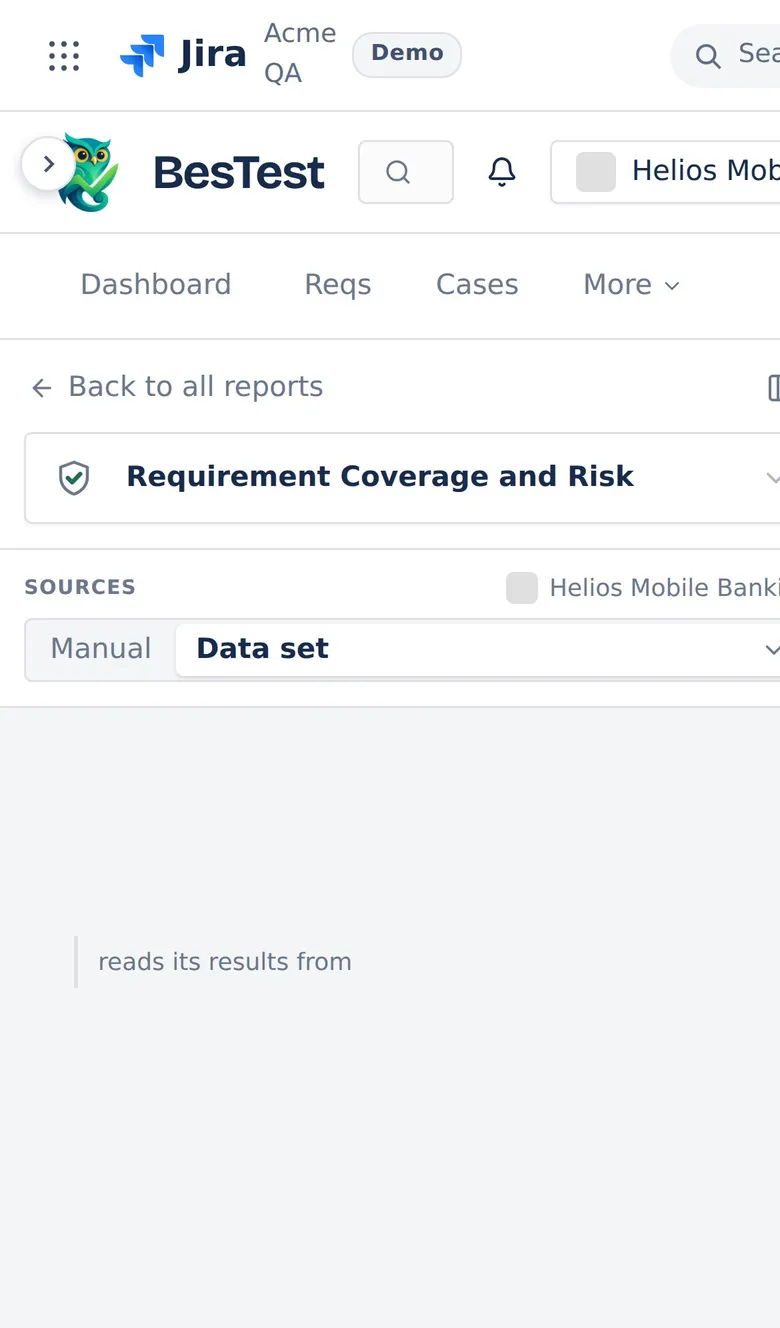
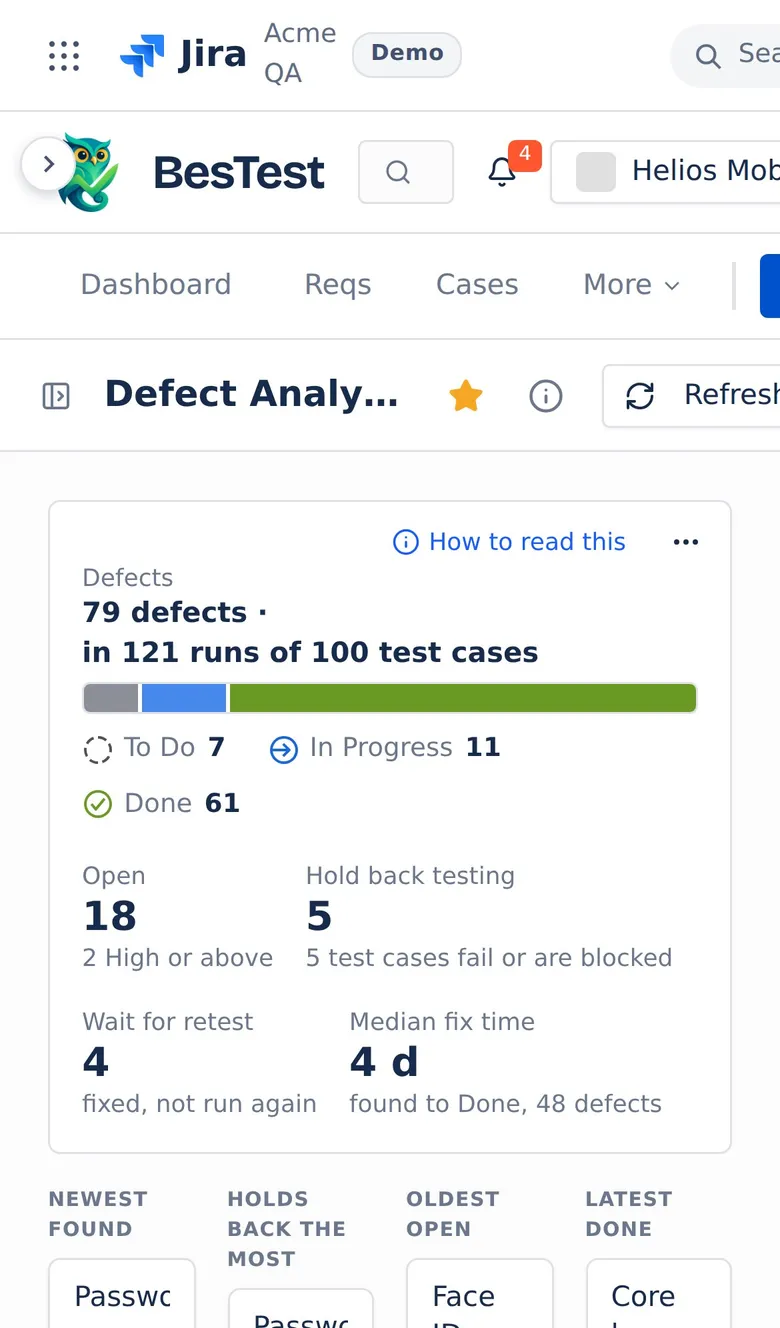
Real screens of the app at 390 px wide, on the Helios demo data. Jira in desktop mode with zoom works too.
Before you ask
What test reports does BesTest add to Jira?
Seven built-in reports, each built around one question: Test Execution Results, the Test Execution Explorer, Test Execution Time, Defect Analysis, Requirement Coverage and Risk, Work Item Traceability and the Traceability Matrix. You can also build custom reports from 20 widgets, and put the same widgets on a Jira dashboard.
How do I create a traceability matrix in Jira?
Open the Traceability Matrix in BesTest and pick your requirements: a folder, all of them, a filter or a data set. Each requirement traces to its Jira work items, test cases, newest results and defects. The gaps stay visible. Print it or export it to CSV.
Can I export a test report to PDF, CSV or Excel?
Every report prints to PDF. Five reports also export CSV, and the Explorer and Time also export Excel. The Explorer prints a test record with a cover page, contents, one block per run and "Executed by" and "Reviewed by" lines to sign.
Can I show test reports on a Jira dashboard?
Yes, as widgets. The BesTest gadget has 20 widget types, for example coverage, execution status and trends.
How is the risk of a requirement set?
From two things: its significance (Impact and Complexity) and its test state, for example Failing, No tests or Passing. One table you can read gives High, Medium or Low. A requirement with no Impact and Complexity is "Not assessed" and gets no risk. See the risk table.
Do I need a BI app for my test reports?
For most teams, no: trends, custom reports and exports are built in. BesTest has no BI connector and no API for report numbers today.
Is it free?
Free for up to 10 users, reports included.
Bring your next release question.
Open the reports full screen on the Helios demo data, or install BesTest free for up to 10 users.