
Custom reports
How to build a custom report: pick a data set, add widgets to the canvas, set the source of each widget, then share, star, print or duplicate it.
A custom report is a report that you build. You put widgets on a canvas: the same 20 widgets as the Jira dashboard gadget. Each widget gets its data from one source of the data set that you pick. For a tour, see the report page.
Questions a custom report answers
A custom report answers the questions that you put on it. For example, a release report can show how the testing goes, the defects, and the coverage of the requirements, on one page.
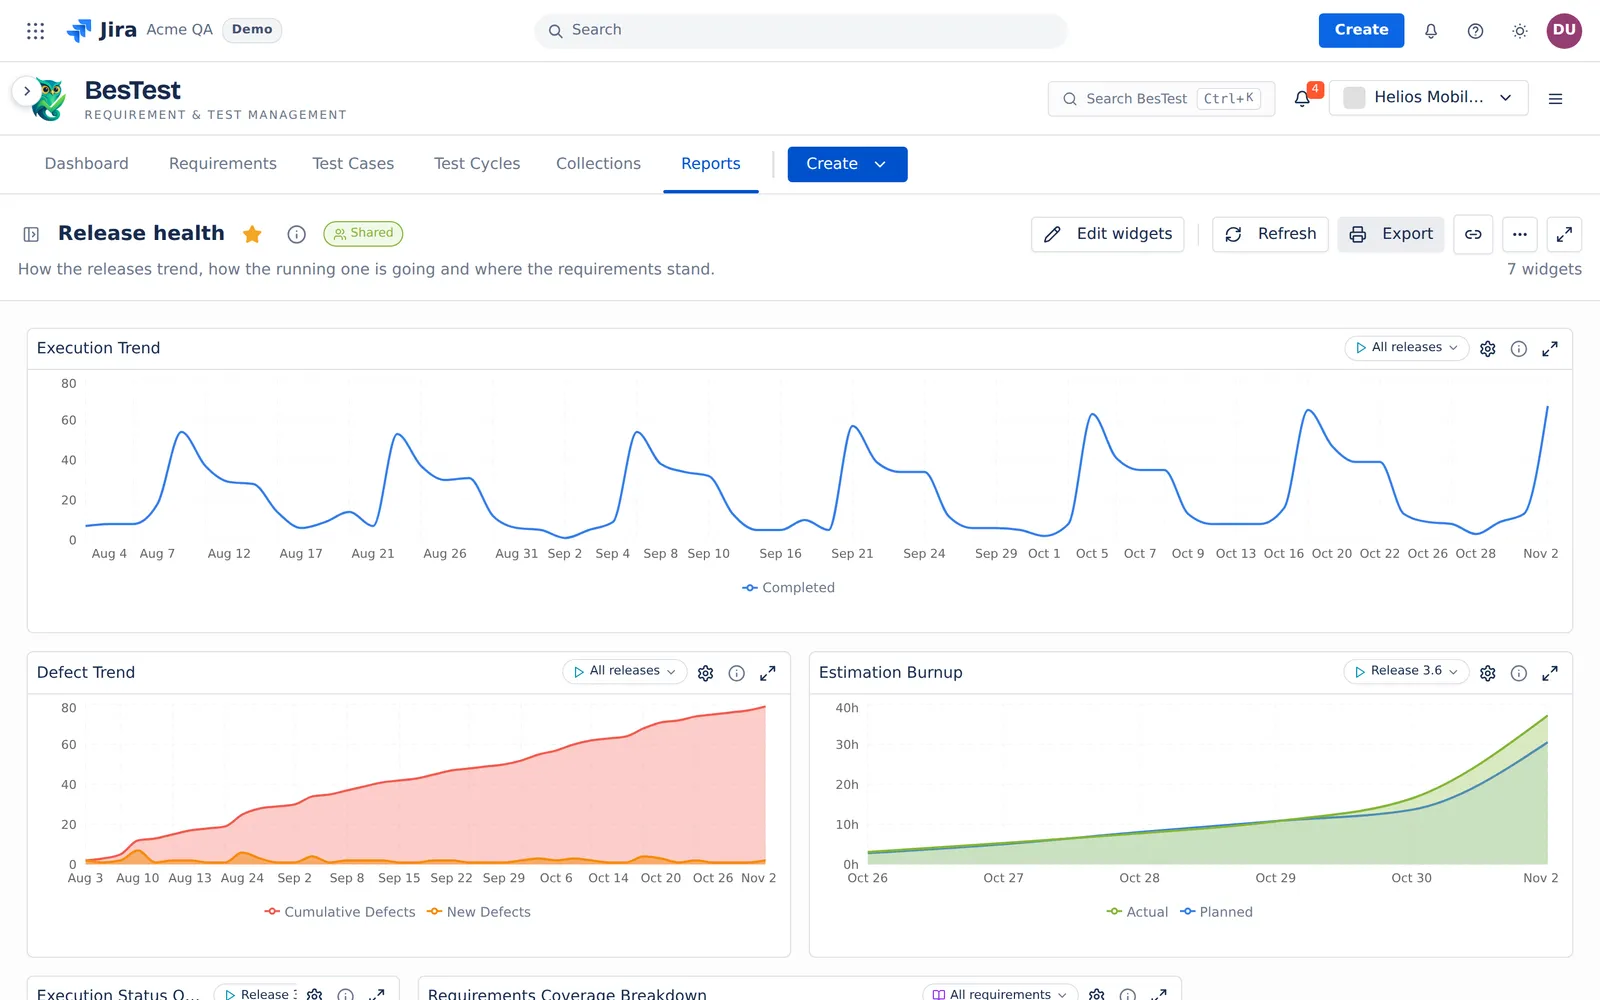
- The report sets: the data set and the widgets that you pick.
- The rule: each widget reads one source of the data set, by the rules of that widget.
- In the demo data: "Release health", with 7 widgets on the data set "Helios releases".
- Then: share the report with the space, and star it for the next release meeting.
Build a custom report
- Open Reports. On All reports, in the Custom reports section, click New custom report. You need the right to write in the space.
- Type a name. The report saves with your first change. Every change after that saves at once.
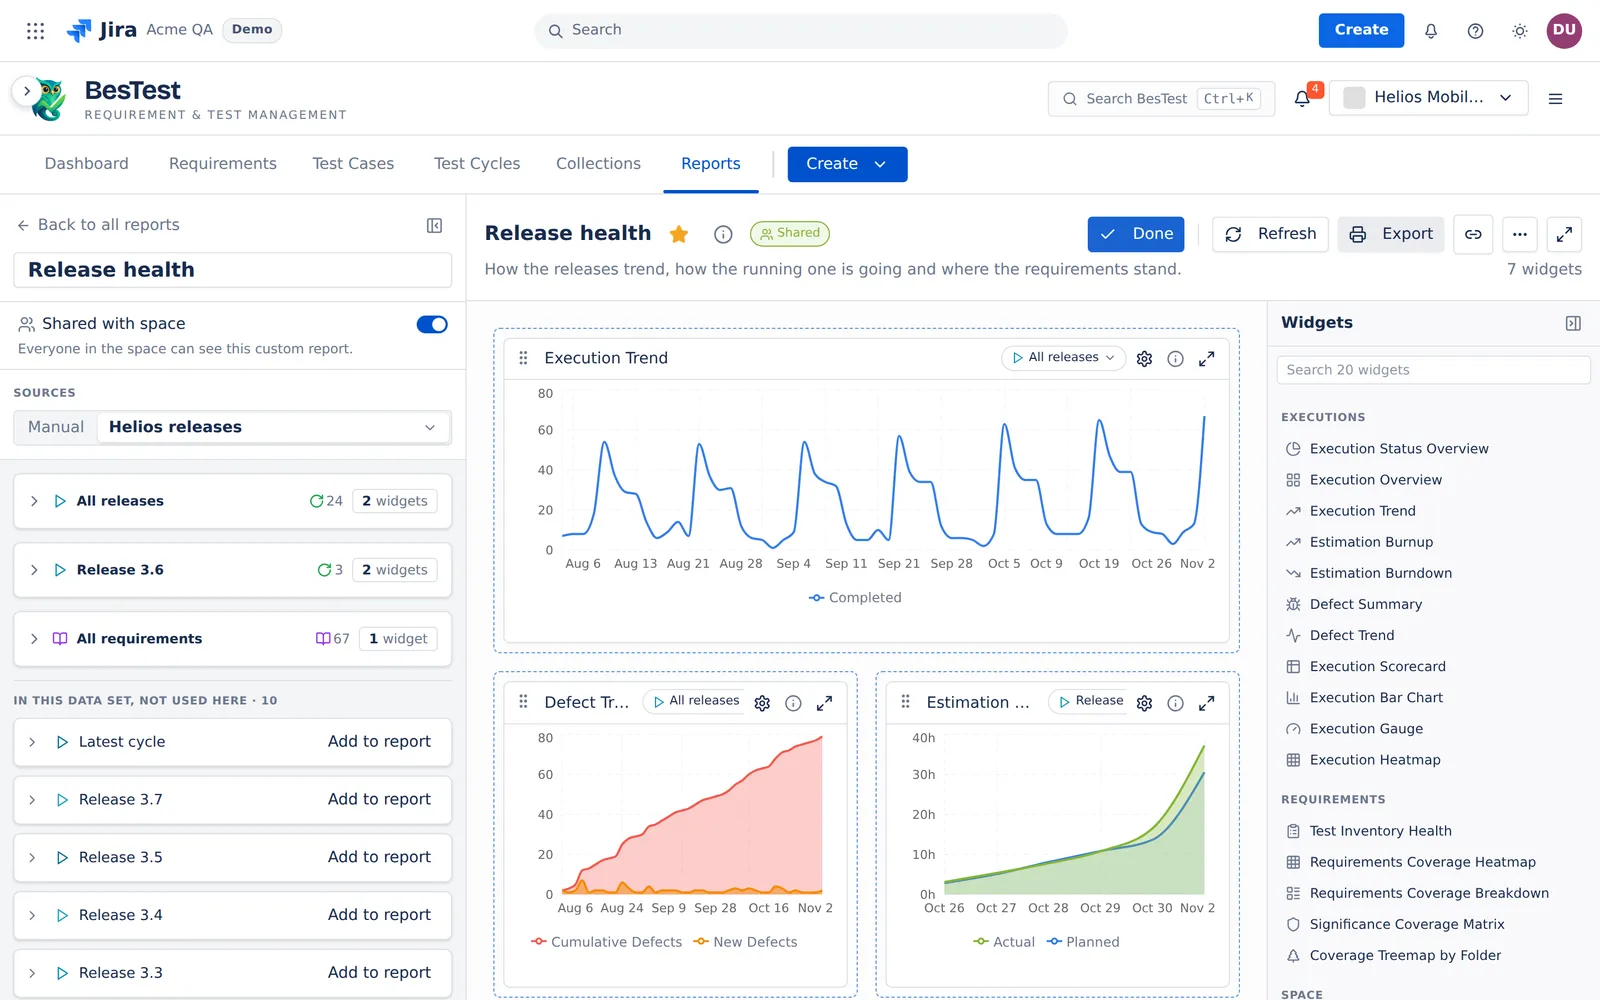
- At the top of the sidebar, under Sources, pick a data set. With Manual, the widgets read the sources that you pick in this browser tab. The report remembers the data set that you pick.
- Add widgets from the Widgets palette. Click a widget to add it at the end, or drag it to its position. The palette groups the widgets by the kind of source they read: Executions, Requirements and Space.
- Click Done to see the report as your team sees it. Click Edit widgets to change it again.
One source per widget
Each new widget gets its source one time, when you add it:
- A widget that reads the space goes to the Space card.
- Else, a source of its kind that no widget reads yet.
- Else, the first source of its kind.
- Else, a new source of its kind.
The sidebar shows one card for each source that a widget reads. In this data set, not used here (in Manual: Not used here) lists the other sources. Add to report adds a widget that reads one of them. Add source adds a new source to the sources of this tab. The Space card is always last. It feeds My Assigned Work, Pending Reviews, Active Cycle Progress and Top Failing Tests.
- Click the source chip on a widget to feed it from another source.
- A widget never reads the whole space. When a widget has no source, it says why: "Pick a source for this widget." or "This widget's source is not in this data set."
- When you remove a source, the widgets that read it ask you to pick a source. Undo in the message puts the source back.
Widget settings
- Click the gear to change the settings and the size (S, M or L) of a widget. The settings that come from the source are locked and show Edit source.
- A widget follows Runs counted and Runs between of its source. A widget that counts only the latest result, such as Execution Trend, always says "Runs counted: Latest result".
- Click the info icon to see what the widget shows: its source, the campaigns and cycles of the source, and its settings.
- Click an item in a widget to open it over the report, as on the Jira dashboard.
The 20 widgets
| Source | Widgets |
|---|---|
| Executions | Execution Status Overview, Execution Overview, Execution Trend, Execution Scorecard, Execution Bar Chart, Execution Gauge, Execution Heatmap, Estimation Burnup, Estimation Burndown, Defect Summary, Defect Trend |
| Requirements | Test Inventory Health, Requirements Coverage Heatmap, Requirements Coverage Breakdown, Significance Coverage Matrix, Coverage Treemap by Folder |
| Space | Active Cycle Progress, Top Failing Tests, My Assigned Work, Pending Reviews |
Each widget follows the same rules in a custom report, on the BesTest dashboard and in the Jira dashboard gadget. The Jira Dashboard Gadgets page describes each one.
Share, star and rights
- A new custom report is private: "Only you can see this custom report." Share with space makes it visible to everyone in the space. Make private reverses it.
- Only the owner of a report can change it.
- Other members can read a shared report, star it, copy its link and duplicate it.
- A space admin can make the shared report of another member private, or delete it.
- A person who can only read the space cannot change anything.
- A star or a link keeps the report and its data set. It always opens the current version of the report.
- When you copy a link in Manual, the message says: "Readers of this report pick their own sources."
- When the report changed in another tab, a save stops with "This report changed somewhere else." Click Reload the report, then make your change again.
Export
Export prints the report (PDF). Refresh reads the data again. Expand shows the report with a short header, for a meeting or a screen.
To save sources once and use them in every report, see Data sets and sources.